Yesterday, this blog looked at job vacancy data for Canada overall and Manitoba specifically. Today, we’ll break it down further along geographical and industrial lines, to see if CFIB is justified in complaining about a so-called labour shortage.
So here is the same Statistics Canada data this blog looked at yesterday[1], only this time the data has been split among the four largest provinces to show regional patterns:
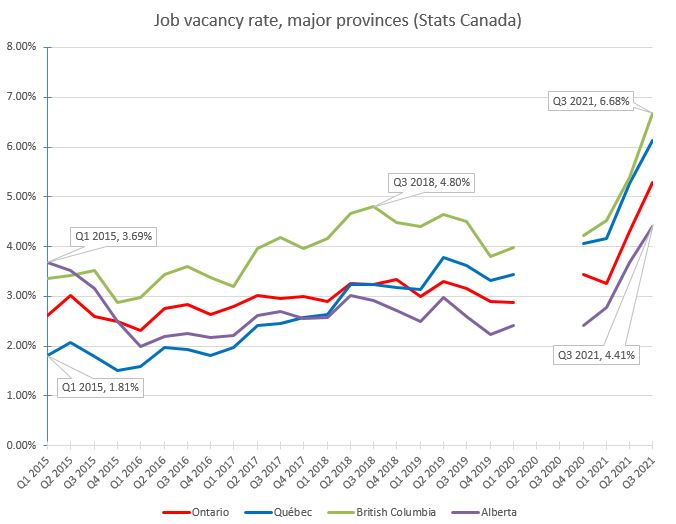
Among the four largest provinces, trends generally follow the Canadian rate. However, there are clear provincial variances. British Columbia chronically has the highest job vacancy rate among the big provinces. Alberta has been under the Canadian rate since early 2016, and has held the lowest job vacancy rate among the major provinces since 2018.
Québec started with the lowest rate (1.81%) in 2015, but has crept up to have nearly the highest rate by 2021. Québec’s problem is a medium-term trend that preceded the pandemic. Finally, Ontario most closely follows the Canadian rate. Understandably, given the province accounts for 38% of the country’s payroll employees.
Looking nationally again, the following graphs displays job vacancy rates for each major industry[2], as defined by the North American Industry Classification System (NAICS). The data isn’t seasonally adjusted, hence the roller-coaster for certain industries between quarters:


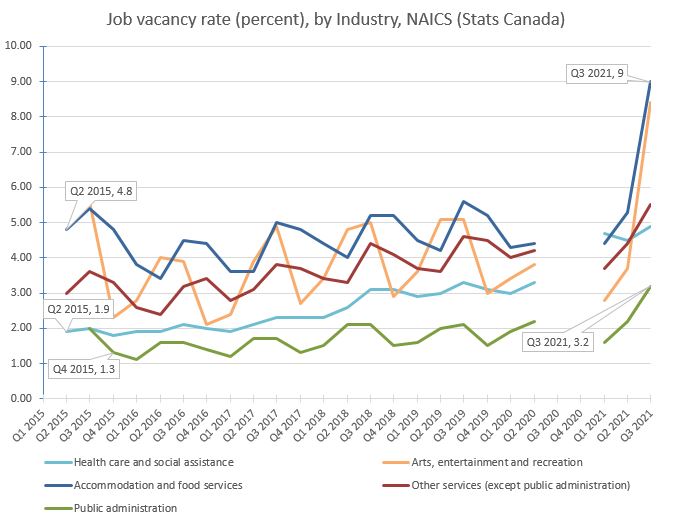
The second graph is rather hard to read, hence usage of dashed lines to clarify a bit.
Wholesale trade appear to be the most unstable over time. There is considerable cycling for accommodation and food services, retail trade, agriculture, and construction, all of which can be explained away by seasonal peaks and valleys.
Food services appear to be the most chronically short staffed, reaching a job vacancy rate of 9% in 2021. Agriculture also seems to suffer from an over-average job vacancy rate, even discounting seasonal effects. Agriculture’s lowest recorded rate (3.5% in Q1 2016) is higher than the Canadian rate for that time (2.15%). This may explain CFIB’s chronic crying about labour shortages, seeing that the vast majority of restaurants would be small businesses and so would be hardest hit.
With all this extra data, it is clear that small business dominated sectors do indeed have a disproportionate labour supply problem.
Now that we have clarified the labour shortage problem, back to the skills shortage problem… next week. Now that I have bored all would-be readers to tears with this flood of data, we’ll go into some pictures and some other diversions before digging back into the ponderous saga of Canadian decline.
References
[1] “Table 14-10-0325-01: Job vacancies, payroll employees, job vacancy rate, and average offered hourly wage by provinces and territories, quarterly, unadjusted for seasonality,” Statistics Canada. DOI: 10.25318/1410032501-eng [Accessed: Jan. 19, 2022]
[2] “Table 14-10-0326-01: Job vacancies, payroll employees, job vacancy rate, and average offered hourly wage by industry sector, quarterly, unadjusted for seasonality,” Statistics Canada. DOI: 10.25318/1410032601-eng [Accessed: Jan. 19, 2022]
